
Quadratic vs Rows: Code-Driven Grids or AI Reporting Hubs (2026)
Verified Oct 6, 2026 by Tooliverse Editorial
Quadratic and Rows are both AI-assisted spreadsheets that accept plain-English requests. Quadratic targets analysts who want Python and SQL in the grid; Rows targets teams building live reports, dashboards, and embeds from connected business tools.
 Quadratic
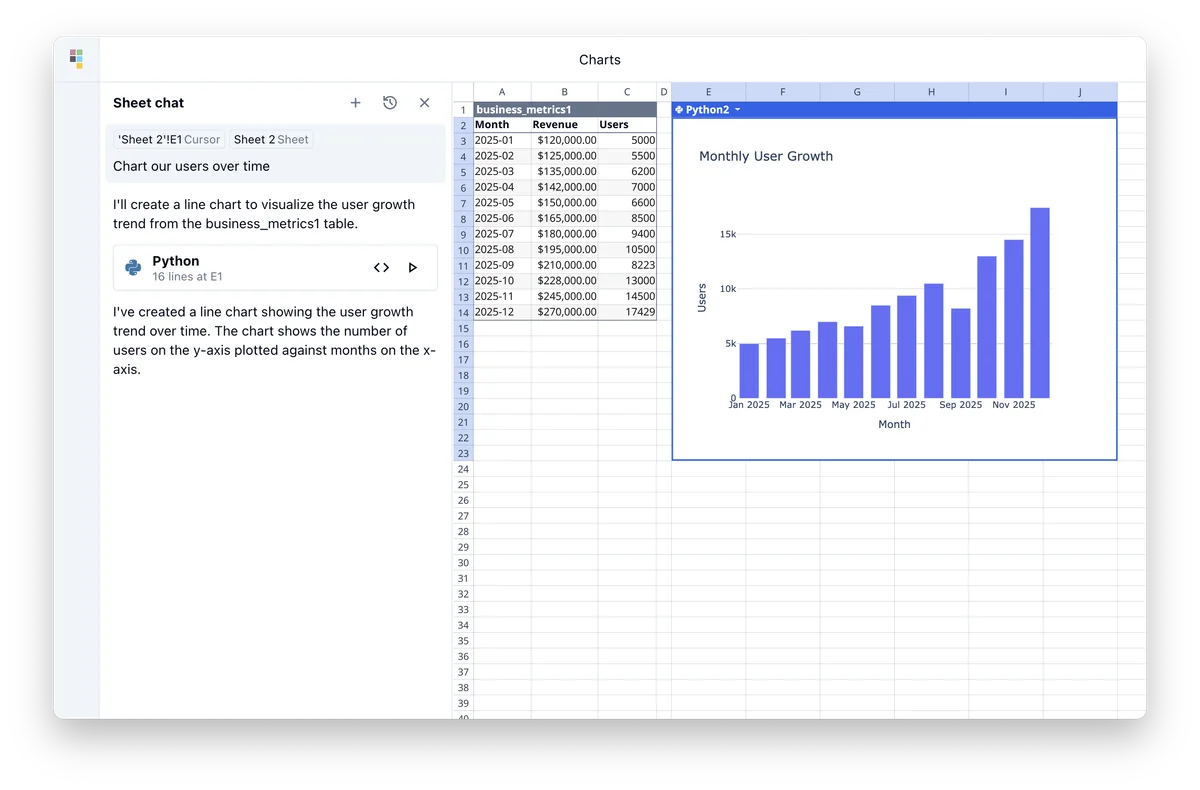
Quadratic workspace showing AI chat generating a monthly user growth bar chart from spreadsheet data with a clean interface.
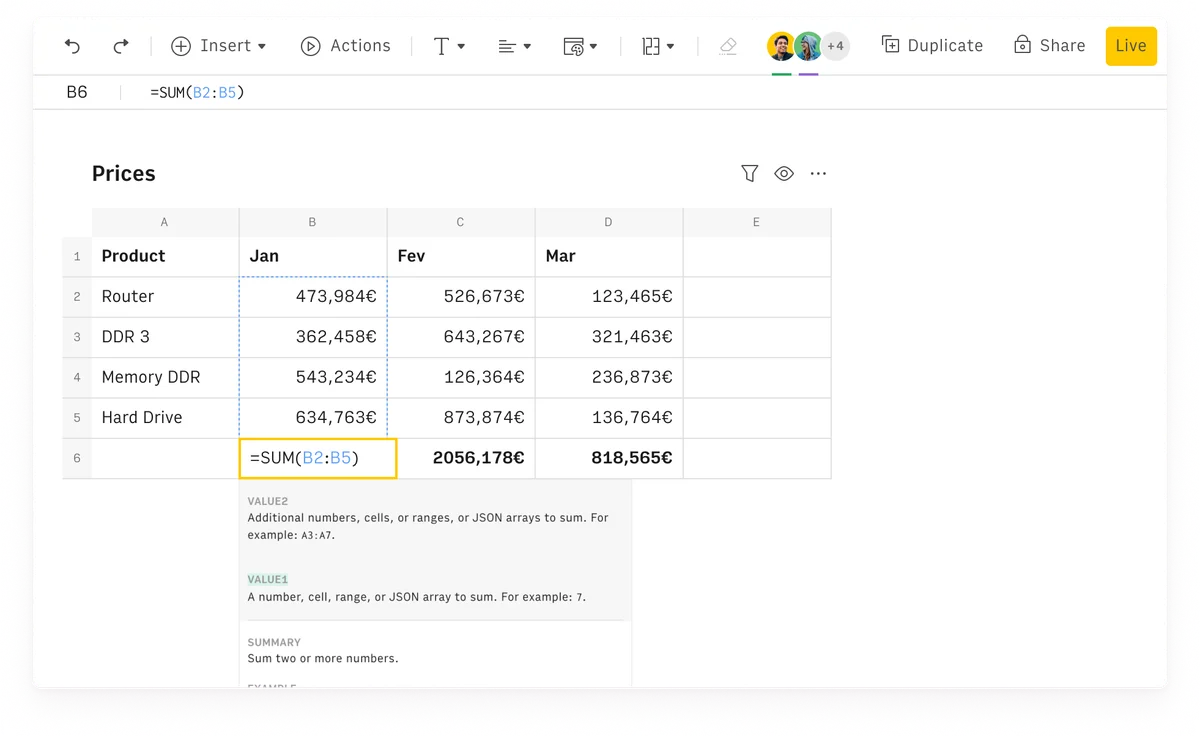
Rows spreadsheet UI showing a SUM formula calculating monthly totals for product prices in a clean, modern interface.
 Quadratic
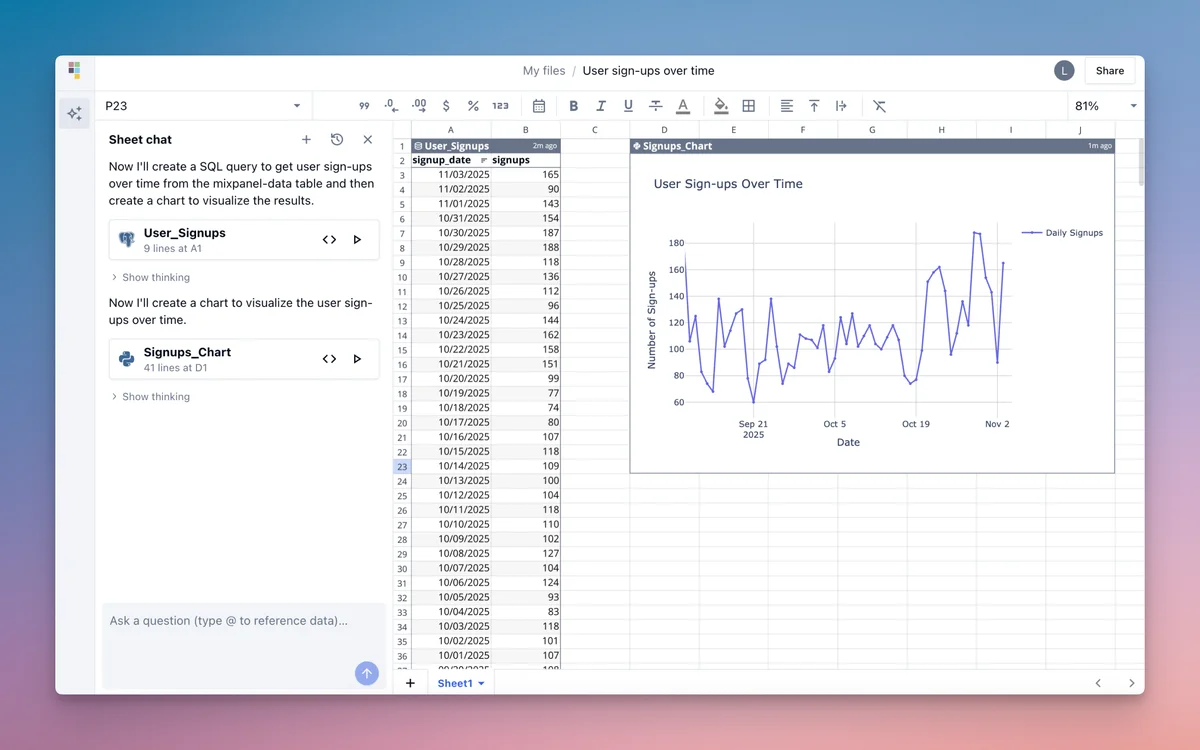
Quadratic workspace showing an AI chat generating a SQL query and a line chart of user sign-ups from spreadsheet data, presented in a clean, light-themed interface.
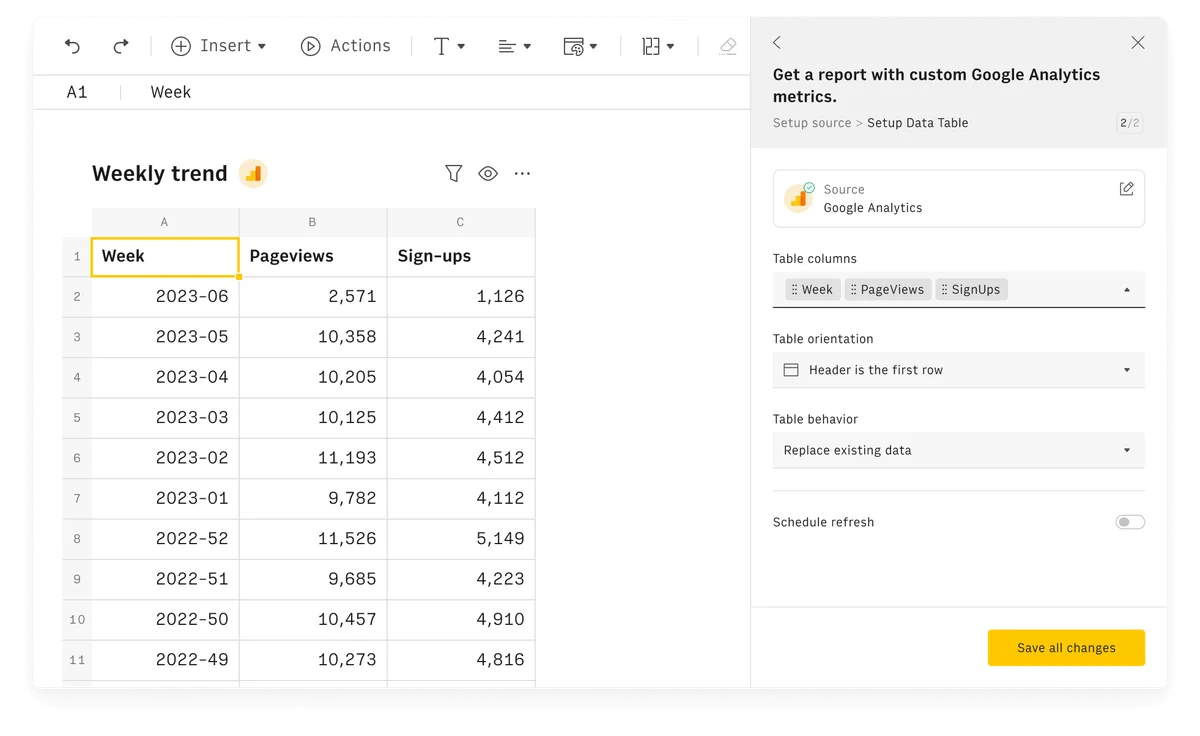
Rows data spreadsheet workspace showing a weekly trend report table and a side panel for setting up custom Google Analytics metrics.
Quadratic vs Rows Review: Tooliverse Consensus





Based on 1,493 verified reviews across 7 platforms,
combined with Tooliverse's expert analysis
Quadratic and Rows score nearly identically, 9.15 from 152 reviews versus 9.11 from 1341. Quadratic is stronger for analysts who want Python and SQL in cells, an infinite canvas, and speed on massive datasets, though it demands coding comfort. Rows leans on its AI Analyst, native Stripe and GA4 integrations, and shareable dashboards, with a cleaner interface. Rows' biggest caveat is that the standalone product was sunsetted in May 2026 after the Superhuman acquisition, and very large datasets slow it down.
Bottom line: Choose Quadratic if your team writes Python or SQL and works with huge datasets; choose Rows for AI-built reports, Stripe and GA4 dashboards, and easy embedding, but weigh its May 2026 standalone sunset first.
Where Each Tool Wins
Strengths unique to each tool (what both do well is covered further down)
Quadratic- •Seamlessly integrates Python and SQL directly into spreadsheet cells for advanced data manipulationmentioned in 84 reviews
- •Provides an expansive infinite canvas that offers total freedom for complex data visualizationsmentioned in 72 reviews
- •Maintains an open-source core that fosters transparency and rapid community-led feature developmentmentioned in 45 reviews
- •Empowers users with an AI Analyst that automates complex data visualization and summariesmentioned in 214 reviews
- •Provides seamless native integrations with marketing and financial tools like Stripe and GA4mentioned in 189 reviews
- •Simplifies the creation of live, interactive dashboards for real-time business trackingmentioned in 142 reviews
Each Tool’s Watch-Outs
Drawbacks unique to each tool
Quadratic- •Presents a significant learning curve for users unfamiliar with Python or SQL syntaxmentioned in 52 reviews
- •Lacks some of the specialized cell formatting and styling options found in Excelmentioned in 41 reviews
- •Contains documentation for advanced API integrations that users find occasionally sparse or incompletementioned in 26 reviews
- •Standalone product sunsetted in May 2026 following the Superhuman acquisitionmentioned in 156 reviews
- •Experiences performance slowdowns when processing exceptionally large datasets with thousands of rowsmentioned in 67 reviews
- •Presents a learning curve for users transitioning from traditional Excel keyboard shortcutsmentioned in 52 reviews
Which Tool Is Best for Your Use Case?
| Use case | Quadratic | |
|---|---|---|
Python and SQL analysis Quadratic runs Python, SQL, JavaScript, and formulas directly in cells (84 mentions), while Rows advertises built-in Python but no SQL. | Excellent | Fair |
Very large datasets Quadratic advertises 100M rows in one sheet, while Rows reviewers report slowdowns on exceptionally large datasets (67 mentions). | Excellent | Fair |
Live marketing and finance dashboards Rows pairs native Stripe and GA4 integrations (189 mentions) with interactive dashboards (142 mentions), and refreshes data as often as every minute. | Strong | Excellent |
Non-coders wanting AI reports Quadratic carries a steep learning curve for users unfamiliar with Python or SQL (52 mentions), whereas the Rows AI Analyst is its top win (214 mentions). | Fair | Excellent |
Sharing and embedding Rows highlights embedding charts and tables anywhere (118 mentions), while Quadratic focuses on live shared spreadsheets and shared AI chats. | Strong | Excellent |

Quadratic asks for code skills; Rows asks for trust. The 156 reviewers who flag Rows' May 2026 sunset and the 52 who flag Quadratic's Python and SQL learning curve are warning different people, so make the call on workflow, not quality. If your team already writes Python or SQL, choose Quadratic and move to Pro at $18/user/month billed annually once Personal's caps bite. If you need Stripe and GA4 dashboards and can accept the sunset, start with Rows Plus at $8/user monthly.
Quadratic vs Rows Pricing 2026
Quadratic starts at $18/user/month on Pro after a free tier to trial it, while Rows starts at $79/month on Pro after a free tier to trial it.
QuadraticPro
- $20 in AI credits / month
- Access to additional models
- Additional privacy controls
- Unlimited sharing, files, and connections
Pro
- Base $79/month plus $8/month per user
- 1,000 AI Tasks per month
- Data tables automate every minute
- 100 integration accounts
- Up to 200 guests, video support
The Costs the Pricing Pages Don't Mention
- Free-tier caps bite quickly
- Quadratic's Personal plan limits AI usage, sharing, files, and connections, while the Rows Free plan allows 5 AI Tasks per month and a 1 MB file import size.
- Annual billing for Quadratic
- Quadratic Pro at $18/user/month and Business at $36/user/month are both billed annually, so those rates assume an annual commitment.
- Rows Pro platform fee
- Rows Pro carries a $79/month base before per-user seats on monthly billing, which is steep for small teams. The annual base is $59/month plus $6/month per user.
- AI credits and import limits
- Quadratic Business allows on-demand AI credit purchases for heavy runs. Rows Plus caps file imports at 5 MB, and larger imports require Pro.
Quadratic vs Rows: Feature Comparison
As advertised on each tool's own site — "not advertised" doesn't necessarily mean missing.
| Feature | Quadratic | |
|---|---|---|
| Both tools | ||
| Plain-English AI analysis | ✓ | ✓ |
| Code in the grid | ✓ | ✓ |
| Data source connections | ✓ | ✓ |
| PDF and document extraction | ✓ | ✓ |
| API access | ✓ | ✓ |
| Collaboration and sharing | ✓ | ✓ |
| Charts and dashboards | ✓ | ✓ |
| Single sign-on | ✓ | ✓ |
| Highlighted by Quadratic | ||
| MCP server for external AI tools | ✓ | not advertised |
| Very large dataset support | ✓ | not advertised |
| Scheduled agent workflows | ✓ | not advertised |
| Highlighted by Rows | ||
| Data enrichment and research | not advertised | ✓ |
| Web table import extension | not advertised | ✓ |
| AI on mobile | not advertised | ✓ |
Quadratic vs Rows: User Reviews
Selected to show the range — the strongest praise and the most useful criticism for each.
QuadraticQuadratic"Quadratic is the spreadsheet I've been waiting for. Being able to write Python in a cell and have it interact with the grid is a game changer for my data analysis workflow."
"The AI Analyst is a total game changer for my workflow. I just ask it to summarize my marketing spend from the last quarter and it builds the charts for me automatically. It saves me at least three hours of manual work every single week."
Quadratic"The infinite canvas is so much better than tabs. I can see my SQL queries, the raw data, and the Python visualizations all in one place without jumping around."
"The built-in OpenAI integration makes data cleaning so much faster than using RegEx or complex nested formulas. I can just describe what I want to extract from a string and it works perfectly almost every time."
Quadratic"Impressive performance. It handles large datasets much better than Google Sheets. The SQL integration is smooth, though I'd like to see more database connectors soon."
"The AI is good but sometimes it hallucinates formula syntax which can be annoying. You definitely need to double check the logic before relying on it for important financial data, but for quick cleaning it is excellent."
Quadratic vs Rows: Frequently Asked Questions (FAQs)
Which has the higher review score, Quadratic or Rows?
Quadratic scores 9.15/10 from 152 verified reviews, and Rows scores 9.11/10 from 1341. The scores are nearly identical, so the choice comes down to workflow rather than rating.
Is Rows still available as a standalone product?
Reviewers flag that the standalone Rows product was sunsetted in May 2026 following the Superhuman acquisition (156 mentions). Anyone planning a long-term rollout should weigh that before committing.
Can I run Python and SQL in both tools?
Quadratic runs Python, SQL, JavaScript, and formulas directly in cells. Rows lists built-in Python for cohorts, forecasts, and clustering without writing code, but doesn't advertise SQL in cells.
How do Quadratic and Rows compare on price?
Quadratic Pro is $18/user/month billed annually, and Business is $36/user/month. Rows Plus is $8/user monthly or $6/user annually, though Pro adds a $79/month base before seats.
Which handles large datasets better?
Quadratic advertises 100M rows in one sheet and multi-GB CSV and Parquet imports. Rows reviewers report slowdowns with very large datasets, and heavy modeling drifts back to Excel for some.
Do both have a free plan?
Yes. Quadratic's Personal plan is free with limited AI usage, sharing, files, and connections. The Rows Free plan includes 5 AI Tasks per month and up to 3 guests.
How this comparison works
Consensus Scores aggregate verified reviews from 8 platforms — Reddit, Product Hunt, G2, Capterra, app stores and more — weighted by source reliability.
Features and pricing come from each tool's official site, last verified Oct 6, 2026. Verdicts are computed from this data.
The Editor's Note is our experts' read of what the data means for your decision — and comparison placement is never for sale. Editorial Policy
Best Quadratic & Rows Alternatives
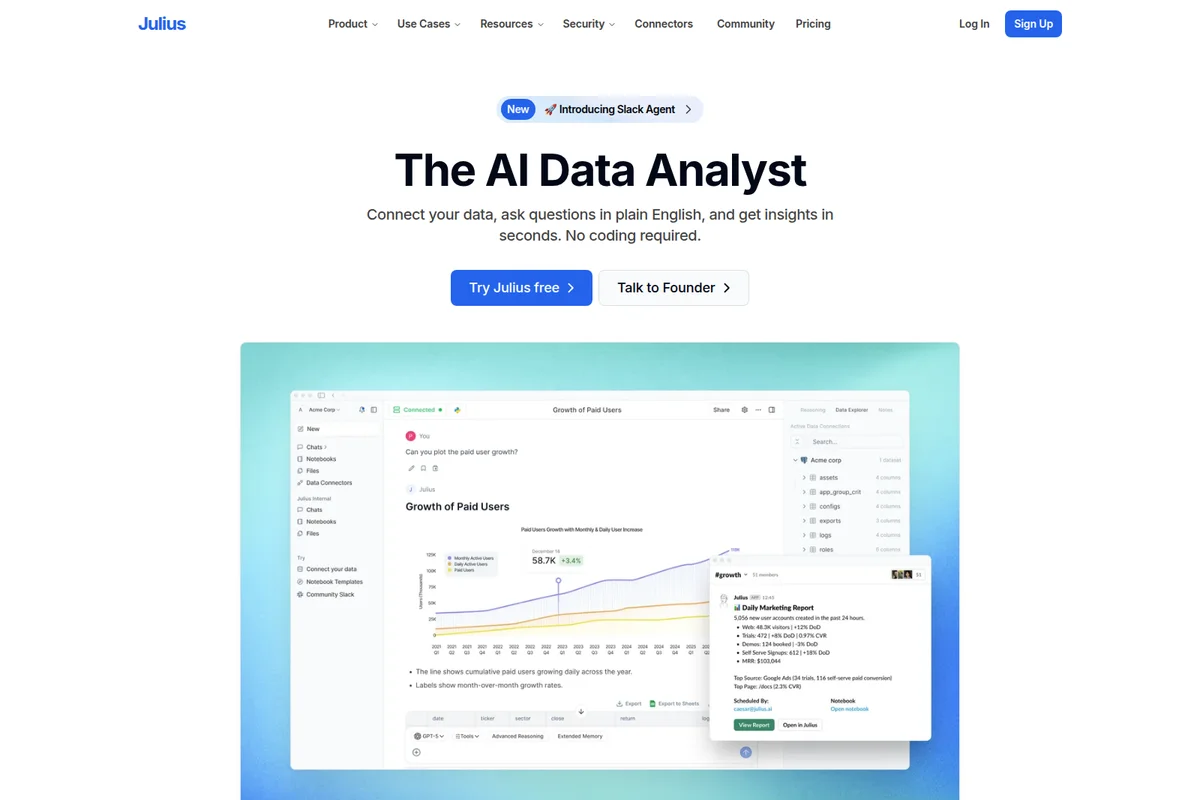
Julius
Turn questions, data, and ideas into finished work, all in one AI workspace.

Hex
Make everyone a data person with trusted AI analytics, from quick questions to deep dives.
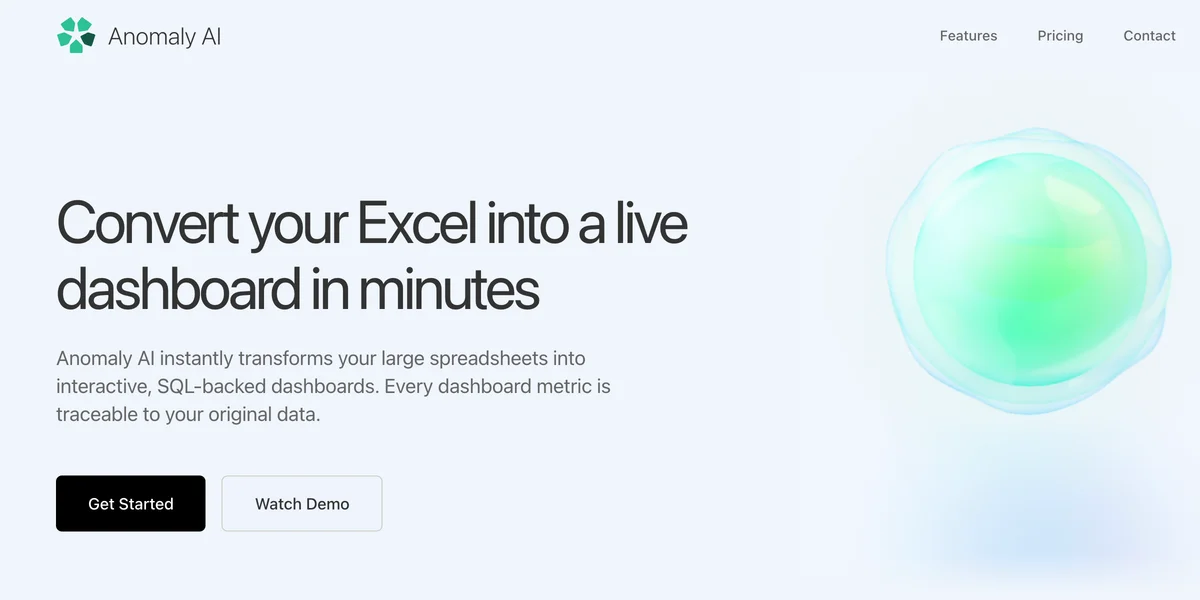
Anomaly AI
Turn messy spreadsheets and databases into dashboards and reports you can actually trust.
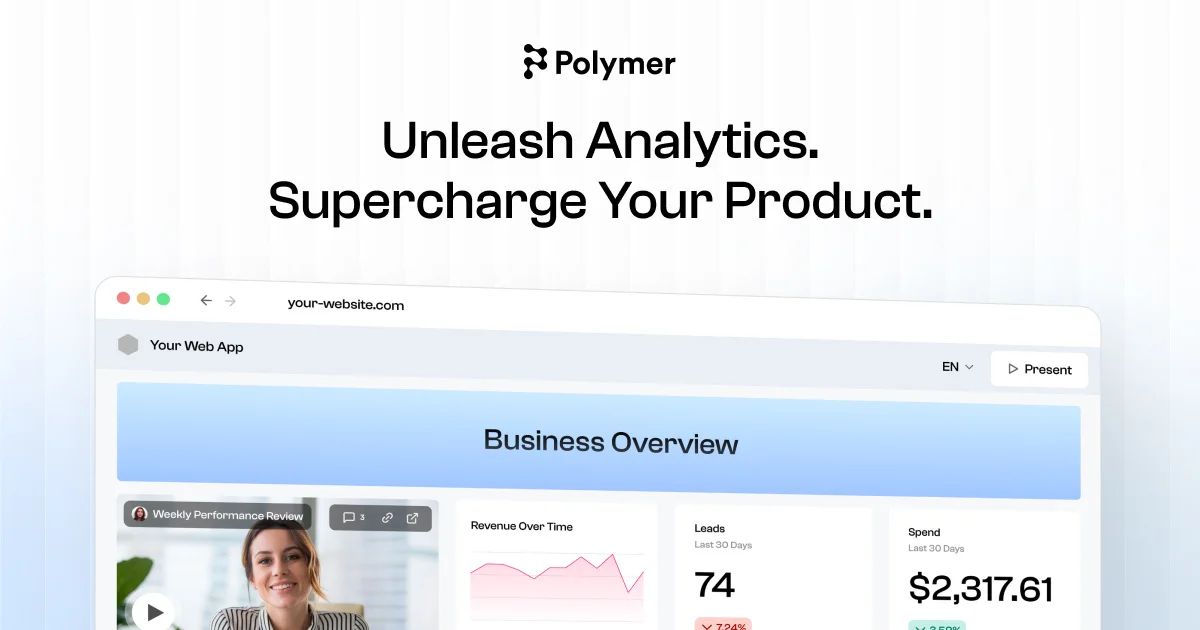
Polymer
Turn messy spreadsheets and ad data into beautiful dashboards in a few clicks, no analyst needed.